 78คะแนน
🏪 ธุรกิจและร้านค้า
Paypers
จัดการใบเสร็จและเอกสารค่าใช้จ่ายด้วย AI
ต้นแบบติดตามการใช้ไฟฟ้าในโรงงานแยกตามพื้นที่
เฝ้าระวังการใช้ไฟฟ้าในโรงงานผ่าน dashboard ต้นแบบที่แสดงยอดใช้ประจำวันและแนวโน้มรายชั่วโมง ตารางรายพื้นที่เปรียบเทียบการใช้กับเกณฑ์ที่กำหนด และแสดงสถานะปกติ เตือน หรือเกินเกณฑ์
https://015-iris-ai-day3-vercel.vercel.app # ⚡ Factory Energy Monitoring (Prototype) ระบบเฝ้าระวังการใช้พลังงานไฟฟ้าในโรงงาน — a single-page dashboard prototype for monitoring factory electricity usage by zone.  ## Features - **Summary cards** — total energy usage today, critical alert count (highlighted red when > 0), and number of monitored zones - **Hourly trend chart** — 24-hour total usage line with a dashed total-threshold line (Chart.js) - **Zone status table** — per-zone current usage, threshold, % of threshold, and a status badge: - ● **Normal** — below 80% of threshold - ▲ **Warning** — at or above 80% of threshold - ✖ **Critical** — over threshold Status badges use icon + text (not color alone) for accessibility. ## Tech Stack | Layer | Tool | Loaded via | |---|---|---| | Styling | [Tailwind CSS 4](https://tailwindcss.com) + [daisyUI 5](https://daisyui.com) (dark theme) | CDN | | Charts | [Chart.js 4](https://www.chartjs.org) | CDN | | Logic | Vanilla JavaScript | [app.js](app.js) | No build step, no dependencies to install. ## Running Open [index.html](index.html) directly in a browser, or serve the folder: ```sh python -m http.server 8000 # then open http://localhost:8000 ``` ## Data All data is mock data defined in [app.js](app.js) (`zones` array) — there is no backend or database connection. Zone status is computed from `currentUsage` vs `maxThreshold`, not hardcoded. ## Notes - The Tailwind browser CDN is for prototypin
โดย nithan-git · ดูโพสต์ต้นทาง
ต้องเข้าสู่ระบบก่อนถึงให้คะแนนได้ เข้าสู่ระบบหรือสมัครฟรี
78คะแนน
จัดการใบเสร็จและเอกสารค่าใช้จ่ายด้วย AI
 71คะแนน
ช่วยค้นหางาน Remote 100% และงานที่สนับสนุน Visa
 71คะแนน
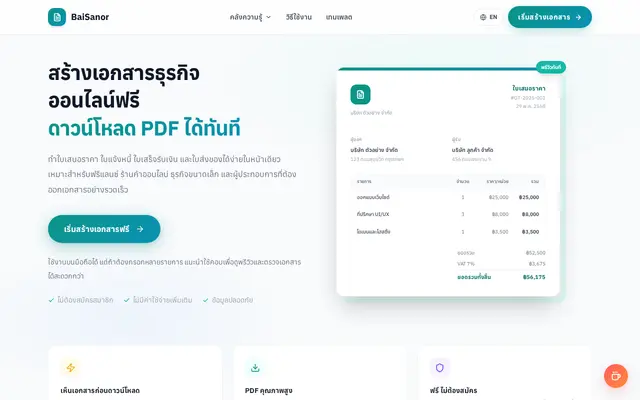
สร้างใบเสนอราคาและเอกสารธุรกิจเป็น PDF
 70คะแนน
รวมรายงาน Affiliate และสร้างวิดีโอพร้อมโพสต์อัตโนมัติ
 69คะแนน
แสดงลูกสุนัขไซบีเรียนฮัสกี้พร้อมจองและจัดส่ง
 69คะแนน
ขอใบเสนอราคา ChatGPT สำหรับองค์กรและสถานศึกษา
เฝ้าระวังการใช้ไฟฟ้าในโรงงานผ่าน dashboard ต้นแบบที่แสดงยอดใช้ประจำวันและแนวโน้มรายชั่วโมง ตารางรายพื้นที่เปรียบเทียบการใช้กับเกณฑ์ที่กำหนด และแสดงสถานะปกติ เตือน หรือเกินเกณฑ์
nithan-git เป็นผู้สร้าง Factory Energy Monitoring ผลงานหมวดธุรกิจและร้านค้า เว็บแอปเทพให้เครดิตเจ้าของผลงานและมีลิงก์กลับไปยังต้นทางทุกรายการ
ตรวจล่าสุดเมื่อ 17 ก.ย. 2569 เปิดไม่ขึ้น รายการนี้จึงถูกลดคะแนนอัตโนมัติ
คะแนนเต็ม 100 คิดจาก 4 ส่วน คือ เว็บยังเปิดใช้งานได้จริง 40 คะแนน (ลิงก์ตายเหลือ 5) คุณภาพเว็บจากการสแกนอัตโนมัติสูงสุด 20 คะแนน (ใช้บนมือถือได้ 5 โหลดเร็วสูงสุด 7 มีคำอธิบายเว็บ 4 มีภาษาไทย 4 รวมคะแนนบรรณาธิการ) ความนิยมในชุมชนต้นทางสูงสุด 20 คะแนน คิดแบบลดหลั่นตามจำนวน reactions และคะแนนดาวจากสมาชิกเว็บสูงสุด 20 คะแนน (ดาวเฉลี่ยคูณ 4)
เป็นเจ้าของผลงานนี้และอยากแก้ข้อมูลหรือนำออก แจ้งเราได้ที่นี่